|
Introduction
The
physical growth and nutritional status of an
individual and/or a community plays a critical
role in maintaining optimal health and well being.
Adequate nutrition is essential for growth,
development and the prevention of various chronic
diseases. [1] Understanding and assessing the
physical growth and nutritional status of
population is crucial for implementing effective
public health interventions and designing targeted
strategies to address nutritional deficiencies.
Nutritional status refers to the overall status of
an individual’s health as influenced by their
dietary intake and nutritional well-being. Optimal
nutritional status is essential for the
maintenance of physiological functions, immune
system integrity, and the prevention of
nutrition-related diseases.[2]
The
intake of recommended amounts of nutrients during
childhood or adolescence is necessary for growth.
Good nutrition is an essential need for children's
health development, well-being, learning, physical
fitness and the ability to withstand stress and to
function at optimum productivity.[3] Numerous
studies have demonstrated the significant impact
of nutritional status on health outcomes across
different life stages. Inadequate nutritional
intake and imbalances in essential nutrients can
lead to malnutrition (both under and over
nutrition), which is associated with increased
susceptibility to infections, impaired growth and
development, and higher mortality rates,
particularly among children. [4-5]
Accurate
assessment of nutritional status is essential for
identifying individuals and populations at risk of
malnutrition or specific nutrient deficiencies.
Anthropometric measurements, including body mass
index (BMI), waist circumferences, and skin fold
thickness are commonly used to evaluate overall
body composition and identify under nutrition or
obesity. [6]
In India, recent
Comprehensive National Nutritional Survey (CNNS)
2016-2018 among the children from birth to 19
years showed that adverse nutritional status of
children is not only restricted to the prevalence
of under nutrition but also to over nutrition as
India is passing through double burden of
malnutrition. [7] The studies of nutritional
status among children and adolescent using
anthropometric measures, have been conducted in
different Northeast Indian tribes for the last two
decades but only few have been reported from
Arunachal Pradesh. [8 -15] This state having
around 26 distinct major tribes with numerous
minor or lesser known tribes is less studied in
term of nutritional status of the children. While
the nation has developed its public health
policies to crop off the double burden of
nutrition, the state is yet to develop a baseline
data to represent the nutritional status of
various major and minor communities. Therefore,
this study was conceptualized to assess the
physical growth and nutritional status using
anthropometric measures and index in the Apatani
and Nyishi tribal children aged five to fifteen
years and compare the two populations living in a
similar ecological setting in Lower Subansiri and
Kamle districts of Arunachal Pradesh.
Methods
Area of Study
The present
cross-sectional study was conducted among the
Apatani tribe of Ziro valley, Lower Subansiri
district and Nyishi tribe of Raga, the headquaters
of Kamle district, Arunachal Pradesh, India. The
data was collected from 12th January to
28th February 2023.
Sample size
and sample selection
The total number of
participants was 442 children from two different
tribal groups (Apatani 231 and Nyishi 211) aged 5
to 15 years. The data were collected using
purposive sampling due to the different terrain of
settlements of the studied households, which
created operational difficulties. Besides,
unavailability and unwillingness from the
participants was another cause for not using
appropriate statistical sampling. However, with
respect to the selection of households and
interviewees, an attempt was made to cover all
those households, whose members were willing to
cooperate in the study, where written consent was
also collected from their parents. The data of the
Apatani samples were collected from several
villages of Ziro valley, Lower Subansiri district
such as Bulla, Siibey, Hari, Hija, Hong,
Bamin-Michi and Dutta and data of Nyishi sample
were collected from several villages of Raga,
Kamle district such as Yada I, Yada II, main Raga
and Raga II. The study was approved by the
Institutional Ethical Committee of Rajiv Gandhi
University, Arunachal Pradesh, India.
Age
estimation
It may be mentioned
that great difficulties were experienced in the
assessment of age, especially from the Raga
headquarter due to their illiteracy and lack of
any written records. Even parents were not aware
of their children’s age. Consequently, in these
cases, estimation of age was done through
referencing to some important local events
(horoscope, flood, storm, festivals etc.) and to
the known age of some individuals who seemed to be
in the same age group and some was ascertained
from birth certificates and official school
records. Thus, in this connection, there could be
some error in the estimation of age.
Socio-economic
data
A pre-tested and
pre-structured scheduled questionnaire was used to
collect some of the socio-economic data including
age, sex and number of parity. Besides, a detailed
ethnographic profile of the two studied
communities was also collected from the field for
general description of the population.
Anthropometric
measurements
The anthropometric
measurements of height (cm), weight (kg), waist
circumference (cm), hip circumference (cm) and mid
upper arm circumference (MUAC), were collected
using standard technique and instruments.
Anthropometer rod was used to collect height (cm)
with a measuring error 0.1 cm, a portable weighing
machine was used to collect weight nearest to 0.5
kg deviation. All circumference measurements were
taken using measuring tape. For height and weight,
the children were wearing light cloths and
standing in anatomical positions with bare feet
and horizontal planes. For circumferences the
cloths were lifted up. [16]
Data
analysis
To assess the
nutritional status of the studied Apatani and
Nyishi children aged 5 to 15 years, a single
anthropometric measure of Body Mass Index (BMI)
was used for obvious operational benefit. BMI was
calculated by using the formula [BMI = weight (kg)
/ height (m2)]. After calculating the
BMI, age and sex matched graded international cut
–off points were used for getting undernutrition
and overnutrition prevalence as per classification
proposed by Cole et al. [17,18]
Statistical
Analysis
Age and sex- wise
descriptive statistics like arithmetic mean,
standard deviation and standard error of mean was
calculated for all the anthropometric measures.
Contingency Χ2 test was used to assess
the association between communities under study
and nutritional status. Bivariate logistic
regression was performed to identify the selected
significant factors associated with overweight and
obese children who were coded as 1 in comparison
to their counterparts coded as 0 for logistic
regression analysis. All the analyses were done
using SPSS 16.0 version and MS Excel 2000.
Brief
description of the population
The Apatani
The Apatani,
designated as a scheduled tribal group, comprising
of approximately 25,000 individuals, live in Ziro
Valley/ Apatani Valley in the Lower Subansiri
district of Arunachal Pradesh, India. Their
language belongs to the Sino-Tibetian family. The
Apatani has a rich oral tradition and hardly any
written records. The inhabitants of the Apatani
valley constitute a community distinct in
language, dress and distinct manner of living. The
Apatanis are mainly agriculturists. This tribe
practices wet rice cultivation, choosing to
permanently settle rather than live a nomadic
lifestyle that comes with slash-and-burn type of
cultivation. This type of cultivation is unique to
the Apatanis. Taking the sustainability of their
fields a step further, the tribe also harvests
fish in the wet fields alongside rice. This
instantly doubles the food production of their
field. The Apatanis have had an intricate
irrigation system of canals and channels from the
time they started wet rice cultivation. Along with
agriculture, the others are engaged in poultry,
hunting and fishing. The people also rear cattle,
pig and goats. The Apatani women are also skilful
weavers. The women collect the firewood for the
household from the woods. They also go to the
nearby food market to sell their agricultural
products. Basketry is a popular handicraft among
the man folk. In recent years, there has been an
increase in white-collar jobs with many of them
engaged as government employees, doctors,
engineers and other modern professionals.
The Nyishi
The Nyishi is the
largest tribal group of Arunachal Pradesh in
India. The word Nyishi is the combination of two
words ‘Nyi’ means ‘a human’ and the word ‘shi’
denotes ‘highlands’. They are spread across eight
districts of Arunachal Pradesh viz., Kra-Daadi,
Kurung Kumey, Papum Pare, East Kameng, West
Kameng, Kamle, Pakke Kessang and parts of Lower
Subansiri district. The presently studied Nyishi
children live in Kamle district. Nyishi speak the
Tibeto-Burman language of the Sino-Tibetan family.
There’s no script yet. Like many other tribes,
they have a rich oral tradition of folklore,
tribal history, and folk wisdom. Whatever is known
of them is passed from generation to generation
through oral traditions. Nyishi food choices
revolve around their agricultural produce viz.
rice, millet, maize, and yams. Rice is the staple
food that is supplemented by meat and vegetables.
They consume boiled food mostly. The meat is
boiled with a little salt in it. No oil or spices
are used. It’s garnished with leafy vegetables and
grated ginger. Sometimes, the meat is roasted or
smoke-dried and kept in bamboo baskets to preserve
it for future use. Bamboo shoots are used to add
flavor to the food. They are particularly fond of
smoked meat.
Results
The arithmetic means
and standard deviations of anthropometric measures
and BMI for both the Apatani and the Nyishi boys
aged 5 to 15 years are shown in Table 1. The
height (cm), weight (kg), waist circumference
(cm), hip circumference (cm) and mid upper arm
circumference (cm) showed a gradual increase over
the age. However, the BMI (kg/m2)
showed fluctuating growth pattern. The maximum
height difference (10.34 cm) between two
successive age groups was found between 12 and 13
years of age among the Apatani boys and 11 and 12
years (8.95 cm of height differences) among the
Nyishi boys. In case of weight measure, the
maximum weight difference (5.56 kg) between two
successive age groups was observed between 11 and
12 years of age among the Apatani boys and 11 and
12 years (5.13 kg of weight differences) among the
Nyishi boys. Rest of the anthropometric measures
showed similar kind of increasing trends among
both the Apatani and Nyishi boys.
|
Table 1: Mean and standard deviation of
anthropometric measures among Apatani and
Nyishi boys
|
|
Age in years
|
N
|
Height (cm)
|
Weight (kg)
|
Waist Cir (cm)
|
Hip Cir. (cm)
|
MUAC (cm)
|
BMI (kg/m2)
|
|
Mean ± SD
|
Mean ± SD
|
Mean ± SD
|
Mean ± SD
|
Mean ± SD
|
Mean ± SD
|
|
Apatani
|
|
5
|
17
|
104.00±6.82
|
17.00±2.57
|
51.53 ±2.60
|
51.76±3.21
|
17.12±1.17
|
15.67 ±1.12
|
|
6
|
13
|
111.35±5.15
|
18.56±3.54
|
51.92 ±3.17
|
54.00±3.14
|
17.92±0.86
|
14.96 ±2.39
|
|
7
|
12
|
120.00±6.32
|
23.93±4.19
|
56.67 ±5.45
|
58.00±5.75
|
18.17±1.95
|
16.57 ±2.30
|
|
8
|
20
|
123.98±4.95
|
24.49±2.92
|
56.90 ±4.58
|
58.70±4.11
|
18.95±1.15
|
15.93 ±1.63
|
|
9
|
13
|
128.69±4.35
|
27.64±5.00
|
59.00 ±8.77
|
60.62±5.84
|
19.54±1.98
|
16.66 ±2.67
|
|
10
|
11
|
135.00±9.14
|
31.55±5.35
|
61.67 ±7.03
|
64.17±4.12
|
19.50±1.97
|
18.44 ±4.41
|
|
11
|
6
|
135.00±8.79
|
34.01±5.23
|
64.22 ±6.37
|
66.27±7.63
|
21.64±2.69
|
17.21 ±1.70
|
|
12
|
9
|
144.33±6.93
|
39.57±9.15
|
65.82 ±7.49
|
67.33±7.28
|
21.89±2.47
|
18.88 ±3.36
|
|
13
|
9
|
154.67±6.56
|
43.81±9.14
|
66.56 ±8.35
|
72.89±9.88
|
22.11±1.76
|
18.12 ±2.04
|
|
14
|
3
|
158.67±7.09
|
44.33±6.66
|
65.00 ±2.00
|
71.00±3.20
|
22.00±2.65
|
17.55 ±1.54
|
|
15
|
9
|
161.11±3.18
|
46.81±8.15
|
66.78 ±4.24
|
73.33±5.51
|
23.00±1.94
|
17.99 ±2.75
|
|
Nyishi
|
|
5
|
13
|
104.31±5.33
|
17.08±2.56
|
52.62 ±2.81
|
52.08±2.43
|
16.00±1.08
|
15.67 ±1.88
|
|
6
|
6
|
110.17±4.71
|
18.83±3.76
|
53.67 ±3.61
|
52.50±2.17
|
16.17±1.17
|
15.38 ±2.13
|
|
7
|
13
|
113.54±6.50
|
20.92±3.62
|
55.54 ±5.11
|
54.38±3.57
|
17.15±1.63
|
16.13 ±1.65
|
|
8
|
11
|
120.27±4.24
|
23.27±2.72
|
55.45 ±3.39
|
57.18±2.96
|
17.18±0.98
|
16.04 ±1.18
|
|
9
|
14
|
126.43±8.49
|
26.86±6.97
|
58.14 ±4.76
|
60.21±4.77
|
17.79±1.58
|
16.54 ±2.59
|
|
10
|
17
|
128.18±6.61
|
26.29±4.36
|
58.29 ±4.43
|
59.06±4.63
|
18.12±1.80
|
15.98 ±2.29
|
|
11
|
13
|
132.69±4.70
|
30.69±6.14
|
63.23 ±5.96
|
63.85±5.34
|
18.92±1.80
|
17.31 ±2.42
|
|
12
|
11
|
141.64±9.44
|
35.82±8.04
|
63.91 ±5.03
|
67.36±7.00
|
20.00±1.95
|
17.66 ±1.90
|
|
13
|
7
|
145.86±8.48
|
38.00±8.70
|
64.14 ±3.76
|
69.00±5.92
|
20.71±1.98
|
17.61 ±2.27
|
|
14
|
9
|
147.89±4.34
|
41.78±5.70
|
64.11 ±2.98
|
69.78±3.67
|
21.33±1.94
|
19.03 ±1.68
|
|
15
|
4
|
153.50±6.03
|
43.50±8.35
|
66.00 ±6.00
|
67.50±7.94
|
21.75±2.75
|
18.43 ±3.08
|
The arithmetic means
and standard deviations of anthropometric measures
and BMI for both the Apatani and Nyishi girls aged
5 to 15 years are shown in Table 2. Like boys, the
height (cm), weight (kg), waist circumference
(cm), hip circumference (cm) and mid upper arm
circumference (cm) showed a gradual increase over
the age among the girls. However the BMI (kg/m2)
showed fluctuating growth pattern. The maximum
height difference (7.37 cm) between two successive
age groups was found between 9 and 10 years of age
among the Apatani girls and 10 and 11 years (10.50
cm of height differences) among the Nyishi girls.
In case of weight measure, the maximum weight
difference (5.82 kg) between two successive age
groups was observed between 10 and 11 years of age
among the Apatani girls and 9 and 10 years (7.53
kg of weight differences) among the Nyishi girls.
Rest of the anthropometric measures showed similar
kind of increasing trends among both the Apatani
and Nyishi girls.
|
Table 2: Mean and standard deviation of
anthropometric measures among Apatani and
Nyishi girls
|
|
Age in years
|
n
|
Height (cm)
|
Weight (kg)
|
Waist Cir (cm)
|
Hip Cir. (cm)
|
MUAC (cm)
|
BMI (kg/m2)
|
|
Mean ± SD
|
Mean ± SD
|
Mean ± SD
|
Mean ± SD
|
Mean ± SD
|
Mean ± SD
|
|
Apatani
|
|
5
|
16
|
108.38±8.83
|
16.32±2.86
|
52.13±3.20
|
52.31±2.80
|
16.69±1.40
|
15.28 ±1.55
|
|
6
|
12
|
112.83±5.42
|
20.43±3.99
|
55.83±6.21
|
57.00±4.16
|
18.00±1.21
|
15.99 ±2.63
|
|
7
|
15
|
119.40±5.79
|
21.00±1.70
|
52.93±3.26
|
55.93±2.89
|
17.67±1.40
|
14.77 ±1.37
|
|
8
|
11
|
126.91±4.28
|
27.90±9.19
|
57.45±7.27
|
61.55±6.27
|
19.18±1.94
|
17.15 ±4.81
|
|
9
|
8
|
130.63±7.31
|
27.84±5.05
|
58.13±7.81
|
61.63±7.11
|
19.63±2.39
|
15.76 ±2.19
|
|
10
|
13
|
138.00±7.19
|
29.09±6.01
|
56.54±7.71
|
62.85±6.96
|
19.85±1.68
|
15.14 ±2.08
|
|
11
|
9
|
141.67±7.35
|
34.91±6.99
|
56.43±9.54
|
66.00±5.48
|
20.29±1.60
|
16.95 ±2.05
|
|
12
|
7
|
142.86±7.60
|
37.97±9.04
|
63.00±6.32
|
68.00±8.37
|
22.44±2.24
|
18.71 ±2.83
|
|
13
|
7
|
147.25±8.97
|
41.36±7.42
|
61.25±5.19
|
69.50±1.29
|
22.29±3.04
|
20.43 ±3.59
|
|
14
|
4
|
150.43±7.41
|
46.12±8.00
|
68.14±9.41
|
73.29±9.53
|
22.50±1.73
|
18.97 ±1.59
|
|
15
|
7
|
149.71±3.99
|
45.55±4.55
|
69.43±6.92
|
77.14±6.36
|
23.71±1.50
|
20.32 ±1.98
|
|
Nyishi
|
|
5
|
15
|
108.53±4.12
|
16.80±1.86
|
52.80±2.83
|
51.13±2.17
|
16.40±0.98
|
15.63±1.04
|
|
6
|
7
|
111.71±1.60
|
18.86±1.57
|
53.71±3.15
|
53.86±1.77
|
16.43±0.79
|
15.13±1.41
|
|
7
|
12
|
117.42±6.02
|
21.33±3.47
|
56.08±3.15
|
56.33±2.84
|
17.00±0.95
|
15.38±1.47
|
|
8
|
11
|
118.82±5.19
|
22.45±3.86
|
53.82±4.05
|
56.36±3.67
|
16.73±1.10
|
15.82±1.83
|
|
9
|
11
|
123.18±6.00
|
23.36±4.43
|
56.73±5.87
|
58.18±4.51
|
17.45±1.86
|
15.31±2.10
|
|
10
|
9
|
130.00±5.87
|
30.89±6.49
|
58.50±3.87
|
63.56±7.43
|
19.22±2.49
|
18.09±2.16
|
|
11
|
4
|
140.50±5.26
|
34.50±5.51
|
60.78±7.74
|
64.50±5.45
|
19.75±2.36
|
17.38±1.58
|
|
12
|
4
|
142.00±5.89
|
38.50±5.92
|
66.50±3.70
|
71.25±4.57
|
21.50±0.58
|
19.04±2.18
|
|
13
|
9
|
146.33±2.60
|
40.00±4.20
|
66.78±8.00
|
70.50±3.62
|
22.33±1.58
|
20.09±2.49
|
|
14
|
6
|
146.17±5.78
|
43.11±6.17
|
66.00±4.60
|
73.56±9.30
|
21.67±1.51
|
18.85±2.85
|
|
15
|
5
|
146.00±9.03
|
43.40±6.39
|
68.60±6.26
|
74.20±9.58
|
22.00±2.92
|
20.10±4.08
|
Table 3 shows the
mean differences of various anthropometric
measurements between Apatani and Nyishi boys and
girls, separately. In most of the ages, Apatani
boys were observed as heavier, taller, with higher
value of other anthropometric measures as compared
to Nyishi boys. Similarly, Apatani girls were
observed as heavier, taller, with higher value of
other anthropometric measures as compared to
Nyishi girls. The differences of anthropometric
measures in both the boys and girls were
statistically significant (p<0.05; p<0.01)
between the ages 8 and 10 years.
|
Table 3:Test of significance of
anthropometric measures among Apatani and
Nyishi boys and girls
|
|
Age in years
|
Height (cm)
|
Weight (kg)
|
Waist Cir. (cm)
|
Hip Cir. (cm)
|
MUAC (cm)
|
BMI (kg/m2)
|
|
Boys
|
|
5
|
0.134
|
0.078
|
1.094
|
0.292
|
2.684*
|
0.009
|
|
6
|
0.475
|
0.152
|
1.067
|
1.053
|
3.697**
|
0.373
|
|
7
|
2.515*
|
1.927
|
0.534
|
1.905
|
1.417
|
0.561
|
|
8
|
2.091*
|
1.138
|
0.916
|
1.708
|
4.313**
|
0.197
|
|
9
|
0.861
|
0.334
|
0.319
|
0.196
|
2.550*
|
0.121
|
|
10
|
2.295*
|
2.768*
|
2.637*
|
3.125**
|
4.159**
|
1.939
|
|
11
|
0.756
|
0.293
|
0.503
|
0.130
|
0.631
|
0.092
|
|
12
|
0.713
|
0.976
|
0.089
|
0.009
|
1.913
|
1.025
|
|
13
|
1.594
|
1.288
|
0.706
|
0.917
|
1.492
|
0.473
|
|
14
|
3.335**
|
0.742
|
0.475
|
1.300
|
0.477
|
1.340
|
|
15
|
3.048*
|
0.671
|
0.271
|
1.713
|
0.950
|
0.258
|
|
Girls
|
|
5
|
0.053
|
0.548
|
0.620
|
1.305
|
0.657
|
0.740
|
|
6
|
0.527
|
0.991
|
0.836
|
1.885
|
3.068**
|
0.798
|
|
7
|
0.869
|
0.327
|
2.530*
|
0.360
|
1.409
|
1.106
|
|
8
|
3.989**
|
1.812
|
1.449
|
2.365*
|
3.647**
|
0.857
|
|
9
|
3.094**
|
2.050
|
0.447
|
1.294
|
2.230*
|
0.456
|
|
10
|
2.757*
|
0.668
|
1.260
|
0.229
|
0.750
|
3.222**
|
|
11
|
0.284
|
0.703
|
1.300
|
0.758
|
1.970
|
0.870
|
|
12
|
0.193
|
0.860
|
1.990
|
1.613
|
1.434
|
1.595
|
|
13
|
1.552
|
0.851
|
0.314
|
0.570
|
0.041
|
0.219
|
|
14
|
0.220
|
0.375
|
1.523
|
0.522
|
0.810
|
0.074
|
|
15
|
0.997
|
0.458
|
0.168
|
0.644
|
1.344
|
0.126
|
| *p<0.05; **p<0.01 |
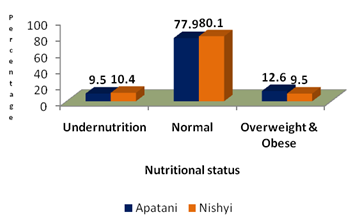
Table 4 shows
community-wise percentage distribution of
nutritional status based on BMI for age among the
studied boys and girls. It was observed that more
than 70% boys from Apatani and Nyishi communities
and more than 80% girls from those respective
communities had normal nutritional status. Overall
percentage of under nutrition was slightly higher
among the Nyishi children (10.4%) compared to the
Apatani children (9.5%) as shown in Figure 1. On
the other hand, the percentage of overweight and
obese children among the Apatani group (12.6%) was
little bit higher than their Nyishi counterparts
(9.5%). In spite of that, boys of both the
communities showed slightly higher percentages of
overweight and obesity compared to their girl
counterparts. However, in both the occasions, the
differences between gender and community-wise
distribution of nutritional status were not
statistically significant (p>0.05).
|
Table 4: Community-wise percentage
distribution of nutritional status (BMI
for age) among the studied boys and girls
|
|
Community
|
Nutritional status
|
Total n(%)
|
|
Undernutrition n(%)
|
Normal n(%)
|
Overweight and obese n(%)
|
|
Boys
|
|
Apatani
|
14 (11.47%)
|
89 (72.95%)
|
19 (15.57%)
|
122 (100.0%)
|
|
Nyishi
|
14 (11.86%)
|
91 (77.11%)
|
13 (11.01%)
|
118 (100.0%)
|
|
Total
|
28 (11.66%)
|
180 (75.0%)
|
32 (13.33%)
|
240 (100.0%)
|
|
Chi-square value
|
1.081, p>0.05
|
|
Girls
|
|
Apatani
|
8 (7.33%)
|
91 (83.48%)
|
10 (9.17%)
|
109 (100.0%)
|
|
Nyishi
|
8 (8.60%)
|
78 (83.87%)
|
7 (7.53%)
|
93 (100.0%)
|
|
Total
|
16 (7.92%)
|
169 (83.66%)
|
17 (8.41%)
|
202 (100.0%)
|
|
Chi-square value
|
0.264, p>0.05
|
|
| Figure 1:
Distribution of Nutritional status among
the Apatani and Nyishi children under
study |
Table 5 depicts the
binary logistic regression analysis of community,
sex and number of live births on overweight and
obese children under study. In this analysis, the
gender and communities were merged as there was
insignificant differences of nutritional status
between parameters. It was found that the Apatani
children were 1.383 times more likely to have
overweight and obesity compared to Nyishi
children. Besides, boys were 1.690 times more
likely to be overweight and obese than girls and
finally children of those families who had ≤ 3
number of live births were observed to have higher
chance of overweight and obesity than those with
more number of children.
|
Table 5: Binary logistic regression
analysis of community, sex and number of
live birth on overweight and obese
children under study
|
|
Variables
|
B
|
S.E.
|
Wald
|
df
|
Sig.
|
Exp (B)
|
95.0% C.I. for Exp (B)
|
|
|
|
|
|
|
|
Lower
|
Upper
|
|
Apatani (Nyishi – Ref.)
|
0.324
|
0.326
|
0.985
|
1
|
0.321
|
1.383
|
0.729
|
2.621
|
|
Boys (Girls- Ref)
|
0.525
|
0.318
|
2.723
|
1
|
0.099
|
1.690
|
0.906
|
3.153
|
|
No. of Live Birth ≤ 3 (> 3 – Ref.)
|
0.030
|
0.333
|
0.008
|
1
|
0.928
|
1.031
|
0.536
|
1.981
|
|
Constant
|
-2.590
|
0.343
|
57.187
|
1
|
0.000
|
0.075
|
|
|
Ref.- Reference group
|
Discussion
This study presents
a glimpse of physical growth patterns and
nutritional status using anthropometric measures
and index of the Apatani and the Nyishi children
aged 5-15 years who live in a similar geographical
hilly terrain (Ziro at Lower Subansiri and Raga at
Kamle districts). Analysis of various
anthropometric measurements (height, weight, WC,
HC, MUAC) and BMI of both the populations revealed
that the mean values of different body
measurements represent an increasing trend with
the advancement of age. The study shows that the
Apatani children are significantly taller and
heavier during pre-adolescent stage compared to
the Nyishi children of both the sexes. A study on
urban Meitei children and adolescents of Manipur
in northeast India also showed that height and
body weight increase along with the advancing of
age in both boys and girls. [19]
It is also evident
from the present study that there was a variation
in both undernutrition and overnutrition
prevalence amongst pre-adolescents and adolescent
children (boys and girls) aged 5 to 15 years among
both the tribes. Comparatively, Nyishi children
had higher prevalence of undernutrition compared
to the Apatani children. In contrast, the Apatani
children had higher prevalence of
overweight/obesity compared to Nyishi children.
Similar kind of studies had been reported by
Asghar et al., where there was significant
variation in both the undernutrition and
overweight prevalence amongst pre-adolescent and
adolescent children among the Sartang and Miji
tribal children aged 5 to 18 years.[8] From the
bivariate logistic regression analysis, the
Sartang children were significantly more than two
times likely to be overweight compared to Miji
counterparts.[8] In the present study, the Apatani
children were 1.383 times more likely to be
overweight and obese compared to Nyishi children,
although the differences were not statistically
significant.
It was found during
the ethnographic fieldwork that Apatani children
were more modernized in their lifestyle and
consumed fast food, had better medical and
educational facilities and exposure to urban
culture than their counterparts among Nyishi
children. It was evident that traditional food
pattern among the tribes of Arunachal Pradesh had
been changed a lot due to globalization.[20]
Therefore, in-depth study of dietary
pattern, physical activity level and morbidity
pattern may be the major limitation of the present
study.
Immunization is one
of the important factors related to nutritional
status of children. The immunization status of the
studied children showed that the percentage of
complete doses of immunization was higher among
the Apatani group (87.01%) compared to Nyishi
group (36.97%) (Not shown in the table). This was
due to lack of awareness among the Nyishi
populations of Raga, Kamle district. In other
words, the majority of the Nyishi children were
born in home and less immunized (63.03%) compared
to National averages. [21] They
do not consider immunization of children as
important and also do not have good medical
facility. In contrast, Apatani population was well
aware of it and had better medical facility than
that of Nyishi population. A micro level regional
study among the Aka boys aged 9 to 18 years in
Arunachal Pradesh showed them to be comparatively
overweight (1.67%) than the present children. [22]
Conclusion
There are some
notable differences between the children of
Apatani and the Nyishitwo tribes in terms of the
mean values of anthropometric measures; the
Apatani children are taller and heavier compared
to the Nyishi counterparts and Nyishi children
have higher values of undernutrition compared to
Apatani children. This suggests that a greater
proportion of Nyishi children in the studied
population are experiencing undernutrition, which
can have detrimental effects on their growth and
development. Addressing undernutrition should be a
priority for policy makers, with a focus on
providing adequate nutrition and healthcare
interventions for Nyishi children. On the other
hand, a larger proportion of Apatani children in
the studied population are overweight or obese,
which can increase the risk of various health
issues such as cardiovascular diseases and
diabetes in their early age. This data can be
useful for policy makers as it highlights the need
for targeted interventions to address both
undernutrition and overweight/obesity among
children in these tribes. Policies should be
developed to improve access to nutritious food,
healthcare facilities, and education on balanced
diets for Nyishi children to combat
undernutrition. Similarly, policies should also
focus on promoting healthy eating habits, physical
activity, and awareness about the risks associated
with overweight/obesity among Apatani children.
However further study is also required to identify
the factors responsible for this disparity between
Apatani and Nyishi children.
Declaration of Conflicting
Interests
The authors declared no potential conflicts of
interest concerning this article's research,
authorship, and publication.
Funding sources:
None
Acknowledgments:
The authors are thankful to the participants of
the present study and also thankful to Rajiv
Gandhi University, Arunachal Pradesh, India for
Financial and logistic support.
References
- World Health Organization (WHO). Physical
status. The use and interpretation of
anthropometry. WHO Technical Report No. 854.
Geneva: WHO, 1995.
- Calder PC, Carr AC, Gombart AF, Eggersdorfer
M. Optimal nutritional status for a
well-functioning immune system is an important
factor to protect against viral infections.
Nutrients. 2020; 12(4):1181.
doi:10.3390/nu12041181.
- Lassi Z, Moin A, Bhutta Z. Nutrition in Middle
Childhood and Adolescence. In: Bundy DAP, Silva
Nd, Horton S, et al., editors. Child and
Adolescent Health and Development. 3rd edition.
Washington (DC): The International Bank for
Reconstruction and Development / The World Bank;
2017. doi: 10.1596/978-1-4648-0423-6_ch11
- Black RE, Victora CG, Walker SP et al.
Maternal and child undernutrition and overweight
in low-income and middle-income countries. Lancet.
2013;382: 427–451. doi:
10.1016/S0140-6736(13)60937-X
- Fan Y, Yao Q, Liu Y, Jia T, Zhang J, Jiang E.
Underlying causes and co-existence of
malnutrition and infections: an exceedingly
common death risk in cancer. Front Nutr.
2022; 9:814095. doi: 10.3389/fnut.2022.814095
- Piqueras P, Ballester A, Durá-Gil JV,
Martinez-Hervas S, Redón J, Real JT.
Anthropometric indicators as a tool for
diagnosis of obesity and other health risk
factors: a literature review. Front Psychol.
2021; 12:631179. doi:
10.3389/fpsyg.2021.631179
- CNNS. Comprehensive National Nutrition Survey
- Birth to Adolescence Arunachal Pradesh
Factsheet 2018. Ministry of Health and Family
Welfare, Government of India, 2018.
- Asghar Md, Amung R, Chakrabarty S. Nutritional
status of children (5-18 years) by using
Anthropometric indices: A cross-sectional study
among the Sartang and Miji, lesser known tribes
of Arunachal Pradesh, India. J Nepal Paediatr
Soc. 2021; 41(3):413-418.
- Singh MS, Devi RKN. Nutritional Status among
the Urban Meitei Children and Adolescents of
Manipur, Northeast India. J Anthropol. 2013:
1-5. http://dx.doi.org/10.1155/2013/983845
- Longkumar T. Physical Growth and Nutritional
Status among Ao Naga Children of Nagaland,
Northeast India. J Anthropol. 2013:
1-6. http://dx.doi.org/10.1155/2013/291239
- Khongsdier R, Mukherjee N. Growth and
nutritional status of Khasi boys in Northeast
India relating to exogamous marriages and
socioeconomic classes. Am J Phys Anthropol.
2003; 122(2):162-170.
- Sikdar M. Nutritional status among the Mising
tribal children of northeast india with respect
to their arm fat area and arm muscle area. Hum
Biol Rev. 2012; 1(4): 331-341.
- Maken T, Verte LR. Nutritional status of
children as indicated by z-scores of the Hmars:
A tribe of N.E. India. Antrocom: Online J
Anthropol. 2012; 8(1): 213-27.
- Saha S, Roy S, Sil SK. Physical growth and
nutritional status of Chakma tribal children of
tripura. Studies in Tribes and Tribals.
2017; 15(1): 18-22.
- Sil SK, Saha S, Roy S, Sarkar SR. Nutritional
status of urban Tripura tribal boys of Agartala,
Tripura. The Anthropologist. 2012;
14(2): 167-9.
- Weiner JS, Lourie JA. Practical Human Biology.
Oxford: Blackwell Scientific Publications, 1981.
- Cole TJ, Bellizzi MC, Flegal KM, Dietz WH.
Establishing a standard definition for child
overweight and obesity worldwide: International
survey. BMJ. 2000; 320(7244):1240-1243.
doi:10.1136/bmj.320.7244.1240.
- Cole TJ, Flegal KM, Nicholls D, Jackson AA.
Body mass index cut offs to define thinness in
children and adolescents: International survey.
BMJ. 2007; 335(7612):194. doi:
10.1136/bmj.39238.399444.55.
- Dkhar JW, Singh MS. Prevalence of Overweight
and Obesity among the Meitei Adolescent of
Manipur, India. The Anthropologist.
2012; 14(4): 347–351. https://doi.org/10.1080/09720073.2012.11891256
- Rinya P. Food transition among tribal and
globalization with reference to Arunachal
Pradesh. J Soc Work Educ Prac. 2017;
2(1): 1-6. https://www.jswep.in/index.php/jswep/article/view/20
- Summan A, Nandi A, Schueller E, Laxminarayan
R. Public health facility quality and child
immunization outcomes in rural India: A
decomposition analysis. Vaccine.
2022;40(16):2388-2398. doi:
10.1016/j.vaccine.2022.03.017.
- Das P, Begum G. Nutritional Status of the Aka
Boys of Arunachal Pradesh. In Converging
Spectrum of Anthropology with Emphasis on Assam
and Adjoining Areas, edited by Bezbaruah, D, EBH
Publishers, India, Guwahati, 2020.
|


