|
Introduction
Under 5
years children are generally considered as
nutritionally vulnerable segments of any Nation.
Malnutrition during childhood can also affect
growth potential and the risk of morbidity and
mortality in later years of life (1). In
developing countries like India, under nutrition
is one of the greatest problems among children.
According to the Global Hunger Index 2023 (2),
India ranks 111th out of the 125
countries. With a score of 28.7, India has
reported a serious level of hunger index. Chronic
under nutrition in childhood is linked to slower
cognitive development and serious health
impairments later in life that reduce the quality
of life of individuals (3). Undernourished
children are at higher risk of death from
infectious diseases due to poor immune response
and host defenses (4). It has been well
established that under nutrition in childhood is
the leading cause of high child mortality rates in
developing countries (5).
Anthropometry is a
widely accepted, low-cost technology for defining
the nutritional status of children (6). Recently,
the World Health Organization (WHO) developed age-
and sex-specific mid-upper arm circumference
(MUAC) cut-off points to determine child under
nutrition (7). In community-based studies,
mid-upper arm circumference (MUAC) appears to be a
superior predictor of childhood under nutrition
than many other anthropometric indicators (6). The
mid-upper arm circumference (MUAC) is an important
measurement that is often used for the assessment
among preschool children.
ICDS (Integrated
Child Development Services) scheme represents one
of the largest and most unique programs in the
Globe implemented for early childhood development
in India. The scheme was launched in the year 1975
(8). The package of services provided by the ICDS
scheme includes supplementary nutrition,
immunization, health check-ups, referral services,
nutrition and health education, and preschool
education (8). Children below six years are the
beneficiaries of this scheme.
However, few amounts
of literature exist regarding the prevalence of
under nutrition based on MUAC among preschool
children in West Bengal (9-13), in India (14-17)
and outside of India (4, 18-24). After an
extensive literature survey, it has been found
that, hitherto there is no work done by any
researcher having a similar kind of objectives.
So, this study aimed to evaluate the nutritional
status of children aged 2-5 years using mid-upper
arm circumference (MUAC) cut-off values. Following
the World Health Organization (7) age and
sex-specific cut-off points are used to assess the
nutritional status of ICDS children of Jalpaiguri,
West Bengal, India.
Material and Methods
A cross-sectional
study was carried out in randomly selected 44 ICDS
centers from January 2022 to October 2023 in
Maynaguri block, Jalpaiguri District, West Bengal,
India. Children aged 24 – 60 months (Boys - 499
and Girls - 522) from three (Rajbanshi, Nama
Shudra, Nashya Seikh) ethnicities were considered
for this study. Date of birth and ethnicity
identified by polio vaccination card provided by
ICDS workers.
The anthropometric
measurement of MUAC was measured by the author
(AB) on each subject following the standard
technique (25). The MUAC was measured using a
non-stretchable plastic measuring tape, to the
nearest 1 mm. The MUAC is the circumference of the
left upper arm, measured at the mid-point between
the tip of the shoulder and the tip of the elbow
(acromion and the olecranon process). Small marks
were made at the identified points. A tape was
placed over those two points, and the midpoint
between them was marked. Then the tape was placed
around the arm in such a manner that it was
touching the skin, but not compressing the soft
tissues
Normal children had
z-scores between -2SD and +2SD. Children with
z-score < -2SD were classified as
undernourished. Children having z-scores between –
3SD and -2SD were classified as moderately
undernourished and those having < -3SD as
severely undernourished.
Age and sex specific
mean and standard deviation of Mid upper arm
circumference was computed. Student’s t-test was
performed to test the sex difference in MUAC.
Analysis of variance (ANOVA) was done to analyse
the significant age differences in the mean values
of MUAC. The Chi-square (χ2) test was also
performed to observe the significant difference in
the prevalence of under nutrition with various
factors. Statistical significance was set at
P<0.05. All types of statistical analysis were
done on SPSS V 18.
Results
|
Table 1: Age and sex-specific
distribution of Mean and standard
deviation of Mid Upper Arm Circumference
(MUAC).
|
|
Mid Upper Arm Circumference
|
|
Age (Months)
|
N (%)
|
Boys (cm)
|
N (%)
|
Girls (cm)
|
t-test
|
|
24-30
|
89 (17.84)
|
13.43 (1.03)
|
83 (15.90)
|
13.50 (1.21)
|
-.405
|
|
31-36
|
79 (15.83)
|
14.05 (1.23)
|
80 (15.33)
|
13.81 (1.31)
|
1.189
|
|
37-42
|
88 (17.63)
|
14.13 (0.85)
|
78 (14.94)
|
14.14 (1.24)
|
-.052
|
|
43-48
|
68 (13.63)
|
14.08 (0.97)
|
90 (17.24)
|
13.93 (1.21)
|
.882
|
|
49-54
|
83 (16.63)
|
14.73 (1.40)
|
94 (18.00)
|
14.33 (1.33)
|
1.918
|
|
55-60
|
92 (18.44)
|
14.83 (1.71)
|
97 (18.59)
|
14.64 (1.05)
|
.940
|
|
24-60
|
499 (100)
|
14.21 (1.33)
|
522 (100)
|
14.08 (1.27)
|
1.679
|
|
F value - 14.777***
|
F value - 9.465***
|
| P<0.001*** |
A total of 1021
children, 48.87 % boys and 51.13 % girls, aged
24-60 months old were measured in the present
study. Table 1 presents the percentage
distribution of the studied children, age and
sex-specific mean (SD) Mid-Upper Arm Circumference
(MUAC) of the sample. The mean MUAC of boys was
higher in every age group except for 24 - 30
months and 37 - 42 months. Age combined mean MUAC
value among boys was 14.21 (1.33) cm was greater
than girls 14.08 cm (1.27). Significant sex
difference in mean MUAC was not found at any age
group. One-way ANOVA reveals the mean MUAC
increased with age. Significant age differences
were found among both sexes for boys (F = 14.777;
p< 0.001) and girls (9.465; p< 0.001).
|
Table 2: Assessment of nutritional status
by using MUAC as a cut-off point
recommended by WHO (2007)
|
|
Age
(Months)
|
N
|
Boys
|
N
|
Girls
|
|
Moderate (-2SD) (%)
|
Severe (-3SD) (%)
|
Normal (%)
|
Moderate (-2SD) (%)
|
Severe (-3SD) (%)
|
Normal (%)
|
|
24-30
|
89
|
26 (30.23)
|
11 (12.79)
|
49 (56.98)
|
83
|
17 (20.48)
|
07 (8.43)
|
59 (71.08)
|
|
31-36
|
79
|
19 (24.05)
|
04 (5.06)
|
56 (70.89)
|
80
|
20 (25.00)
|
03 (3.75)
|
57 (71.25)
|
|
37-42
|
88
|
21 (23.86)
|
03 (3.40)
|
64 (72.74)
|
78
|
13 (16.67)
|
04 (5.13)
|
61 (78.20)
|
|
43-48
|
68
|
20 (29.41)
|
05 (7.35)
|
43 (63.24)
|
90
|
27 (30.00)
|
12 (13.33)
|
39 (56.67)
|
|
49-54
|
83
|
18 (21.68)
|
02 (2.41)
|
63 (75.91)
|
94
|
29 (30.85)
|
03 (3.19)
|
32 (65.96)
|
|
55-60
|
92
|
20 (21.73)
|
02 (2.17)
|
70 (76.10)
|
97
|
28 (28.86)
|
01 (1.03)
|
29 (70.10)
|
|
24-60
|
499
|
124 (24.85)
|
27 (5.41)
|
151 (69.74)
|
522
|
134 (25.67)
|
30 (5.75)
|
164 (68.58)
|
Table 2 describes the age and sex-specific
prevalence (%) of under nutrition based on MUAC
among the studied preschool children. The overall
percentage of moderate and severe undernourished
girls (moderate – 25.67 %; severe – 5.75 %) is
higher than the boys (moderate – 24.85 %; severe –
5.41%). The highest percentage of moderate under
nutrition was found in the age group 24-30 months
among boys (30.23 %) and 49-54 months among girls
(30.85 %). Whereas, the highest percentage of
severe under nutrition was found in the age group
24-30 months among boys (12.79 %) and 43-48 months
among girls (13.33 %).
|
Table 3: Age and Sex wise prevalence of
under nutrition among studied children
|
|
Undernourished (%)
|
Normal (%)
|
Total (%)
|
(χ2)
|
|
Age (Months)
|
|
24-30
|
61 (35.47)
|
111 (64.53)
|
172 (16.84)
|
13.345*
|
|
31-36
|
46 (28.94)
|
113 (71.06)
|
159 (15.57)
|
|
37-42
|
41 (24.70)
|
125 (75.30)
|
166 (16.26)
|
|
43-48
|
64 (40.51)
|
94 (59.49)
|
158 (15.48)
|
|
49-54
|
52 (29.38)
|
125 (70.62)
|
177 (17.34)
|
|
55-60
|
51 (26.98)
|
138 (70.02)
|
189 (18.51)
|
|
24-60
|
315 (30.85)
|
706 (69.15)
|
1021 (100)
|
|
Sex
|
|
Male
|
151 (30.26)
|
499 (69.74)
|
499 (48.87)
|
2.178NS
|
|
Female
|
164 (31.42)
|
358 (68.58)
|
522 (51.13)
|
|
*p<0.05, NS – Not Significant |
Table 3 shows the
sex-combined age-specific under nutrition based on
the MUAC cut-off value recommended by WHO 2007.
The highest percentage of under nutrition was
found in the age group 43-48 months (40.51 %) of
children and the lowest percentage of under
nutrition was found at 37-42 (24.70%) months of
children. Chi-square analysis (χ2-13.345) shows a
statistically significant relationship of under
nutrition with age groups. Results show that
female has a higher percentage of under nutrition
31.42 % than males 30.26 % but there is no
statistically significant relationship between
under nutrition with gender.
|
Table 4: Association of socio-economic
and socio-demographic factors with the
prevalence of MUAC-based under nutrition.
|
|
Factors
|
Sub-categories
|
N
|
Prevalence
|
(χ2)
|
|
Birth Weight
|
<2500 gm
|
297
|
126 (42.42)
|
26.291***
|
|
≥2500 gm
|
724
|
189 (26.10)
|
|
Ethnicity
|
Rajbanshi
|
349
|
95 (27.22)
|
19.815***
|
|
Namasudra
|
334
|
85 (25.45)
|
|
Nashyaseikh
|
338
|
135 (39.94)
|
|
Birth Order
|
1st
|
608
|
163 (26.80)
|
16.006***
|
|
2nd
|
358
|
125 (34.91)
|
|
3rd and above
|
55
|
27 (49.09)
|
|
Number of Siblings
|
0
|
461
|
115 (24.95)
|
18.165***
|
|
1
|
474
|
161 (33.97)
|
|
2
|
86
|
39 (45.35)
|
|
Bath Place
|
Open
|
401
|
151 (37.66)
|
14.329***
|
|
Closed
|
620
|
164 (26.45)
|
|
Fuel of Cooking
|
Wood
|
772
|
252 (32.64)
|
17.559***
|
|
Crop residue
|
15
|
10 (66.66)
|
|
LPG
|
234
|
53 (22.64)
|
|
Income level
|
<7501
|
289
|
118 (40.83)
|
18.911***
|
|
7501-15000
|
585
|
159 (27.18)
|
|
>15000
|
147
|
38 (25.85)
|
|
Asia specific Maternal BMI level
|
<18.5
|
110
|
40 (36.36)
|
28.728***
|
|
18.5-22.9
|
547
|
195 (35.65)
|
|
23-24.9
|
176
|
51 (28.98)
|
|
≥25
|
188
|
29 (15.43)
|
|
***p<0.001
|
Table 4 shows the
association between socio-economic and
socio-demographic variables prevalence of
mid-upper arm circumference-based under nutrition.
Birth weight below 2500 gm, children from
Nashyaseikh community, birth order 3rd
and above, number of siblings 2, open type of bath
place, crop residue as a fuel for cooking, monthly
income level Rs. <7501, maternal BMI level
<18.5 having the highest prevalence of
undernourished children. The χ2 analysis shows
that there were several factors such as birth
weight, ethnicity, birth order, number of
siblings, bath place, fuel of cooking, income
level and Asia-specific maternal BMI level were
statistically significant with the prevalence of
MUAC-based under nutrition.
Discussion
Childhood
malnutrition is an important health problem in
developing countries like India. The mean age of
children in our study was 42.48 (10.88) months for
boys and 43.14 (10.62) months for girls. In the
present study, the overall prevalence of under
nutrition was 30.85 %. The present study
documented that the overall prevalence of under
nutrition among girls (31.42 %) is higher than
that of boys (30.26 %), with few similar findings
reported by several scholars (11,17,24) and
contrary to the previous findings (4,10,13). The
percentage of moderate under nutrition is higher
than severe under nutrition among both genders.
The overall age and sex combined prevalence of
under nutrition was 30.85 % of which 25.27 % and
5.58 % of children were moderately and severely
undernourished, moderate under nutrition was found
higher than severe undernourished similar to the
previous studies (4,9,10,13,24).
In our study, we
found that the nutritional condition of ICDS
beneficiaries was serious with high rates of under
nutrition. The highest percentage of under
nutrition was found among Nashya Seikh children,
Rajbanshi children and Nama Shudra children
respectively. We suggest that more studies dealing
with under nutrition based on MUAC should be
undertaken among children of different
ethnicities. It was noticed that age, sex, and
ethnicity play a significant role in determining
the MUAC (4,9,10,13,24,26). Measurement of MUAC is
a quick and reliable method for screening children
to identify those who are seriously malnourished
(10,13). The application of MUAC appears to be a
better predictor for the assessment of childhood
under nutrition than many other anthropometric
indicators (11). The important finding of the
study is the significant association of age group
and ethnicity found with under nutrition in the
present study similar to a study previous study
(26).
|
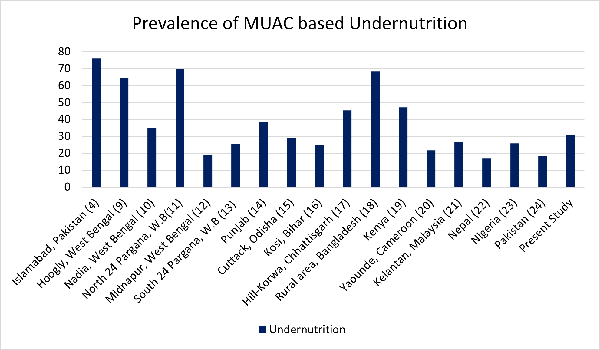
| Fig
1: Comparison of national and
international studies on the prevalence of
under nutrition based on MUAC |
Fig 1. Shows
comparison with international studies reveals that
the prevalence of under nutrition in the present
study is higher than the children of Cameroon
(21.60 %), Malaysia (26.80 %), Nepal (17 %),
Nigeria (25.70 %) and Pakistan (18.30 %). In the
context of India, the present study reported a
higher prevalence of under nutrition than the
children of Midnapur (18.96 %), South 24 Pargana
(25.61 %) of West Bengal, Odisha (29.10 %), Bihar
(25 %). Whereas higher prevalence was found than
the present study among children of Hooghly (64.50
%), Nadia (35.11 %) North 24 Pargana (69.80 %) of
West Bengal, Chhattisgarh (45.20 %), Punjab (38.52
%) in India. International studies from Kenya (47
%), Bangladesh (68.30 %) and Pakistan (76 %) show
a higher prevalence of under nutrition than the
present study.
Several
socio-economic and socio-demographic factors are
strongly associated with the prevalence of
MUAC-based under nutrition. Studies reported that
girls are more affected by under nutrition than
boys in rural areas(18,27). Birth Weight below
2500 grams has a significant relationship with
under nutrition(28-30). Different ethnic
backgrounds have an impact on child under
nutrition similar to the previous studies(31,32).
Few studies reported that birth order is highly
associated with under nutrition(18,27,33,34). A
higher number of siblings is also a reason behind
child under nutrition(35,36). There is a
significantly greater association of under
nutrition with children belonging to lower-income
groups (27,38,39). Maternal BMI level has an
impact on child under nutrition similar to
previous finding (37).
The present study
reveals that birth weight, ethnicity, birth order,
number of siblings, bath place, fuel of cooking,
income level and Asia-specific maternal BMI level
were important determinants of under nutrition
among children.
Conclusion
Assessment of
nutritional status by Mid Upper Arm Circumference
is a simple, reliable, easy-to-perform,
inexpensive, and conventional method for preschool
children. Furthermore, research on MUAC
representing communities with a larger sample size
is essential to monitor health status. Mid-upper
arm circumference-based under nutrition becomes
more effective for comparing the age and
sex-specific regional and ethnic differences of
children. Thus regular monitoring of health
scenarios among ICDS beneficiaries by MUAC may be
helpful to ameliorate the nutritional deficiencies
among preschool children. Therefore, the
Government should implement the policy of regular
surveillance in the form of nutritional surveys
and may also utilize the socio-economic and
socio-demographic variables as determining factors
of child malnutrition.
Acknowledgement
The researchers would like to thank
all the concerned ICDS workers and also the
parents of the subjects for their cooperation. We
thank those children who participated in this
research work. Special thanks to the CDPO of
Maynaguri for his support. However, the authors
assume full responsibility for all data and
content presented. Arindam Biswas recipient of a
Senior Research Fellowship (SRF-UGC-NET) by the
Government of India.
References
- Alderman H, Jesko H, Ricardo S. With the help
of one's neighbors: externalities in the
production of nutrition in Peru. Social
science and medicine. 2003;56:2019-2031.
- Global Hunger Index. India. Available at https://www.globalhungerindex.org/india.html
Accessed May 25th, 2024.
- Scrimshaw NS. Nutrition and health from womb
to tomb. Food and Nutrition Bulletin.
1997;18:1-21.
- Qayyum H, Mahwish R, Shagufta S, et al.
Mid-Upper Arm Circumference (MUAC) as an
Assessment Tool, To Assess Nutritional Status in
Children Aged 6-60 Months in A Tertiary Care
Hospital, Islamabad. Age.
2021;12:1-92.
- Pelletier DL, The relationship between child
anthropometry and mortality in developing
countries: implications for policy, programs and
future research. The Journal of Nutrition
1994; 124: S2047-S2081.
- World Health Organization. World Health
Organization physical status: the use and
interpretation of anthropometry. World Health
Organization, Geneva. 1995.
- World Health Organization, Nutrition for
Health. WHO child growth standards: head
circumference-for-age, arm
circumference-for-age, triceps skinfold-for-age
and subscapular skinfold-for-age: methods and
development. WHO. 2007.
- Kapil U, Pradhan R. Integrated Child
Development Services scheme (ICDS) and its
impact on nutritional status of children in
India and recent initiatives. Indian
Journal of Public Health. 1999;43:21-25.
- Mandal GC, Bose K. Assessment of under
nutrition by mid-upper arm circumference among
preschool children of Arambag, Hooghly District,
West Bengal, India: An observational study. Internet
J Pediatr Neonatol 2009;11(1).
- Biswas S, Bose K, Mukhopadhyay A, et al.
Mid-upper arm circumference based under
nutrition among Bengalee children of Chapra,
West Bengal, India. Iranian Journal of
Pediatrics 2010; 20 (1):63.
- Bisai S. Nutrition status based on mid upper
arm circumference among urban, poor pre-school
children in north 24 Parganas, West Bengal,
India. Serbian Journal of Experimental and
Clinical Research. 2010; 11(4):141-145.
- Maiti S, De D, Ali KM et al. Evaluation of
Nutritional Status by Mid-Upper Arm
Circumference Amongst Affluent Children. Journal
of Nepal Paediatric Society 2012; 32(2).
- Giri SP, Biswas S, Bose K. Assessment of
Nutritional Status Using Mid-Upper Arm
Circumference among Bengalee Preschool Children
of Sagar Island, South 24 Parganas, West Bengal,
India. J Life Science. 2019;
11(1-2):1-6.
- Kaur G, Kang HS, Singal P, et al. Nutritional
status: anthropometric perspective of pre-school
children. The Anthropologist. 2005;
7(2):99-103.
- Mishra BK, Mishra S. Nutritional anthropometry
and preschool child feeding practices in working
mothers of central Orissa. Studies on Home
and Community Science. 2007;
1(2):139-144.
- Singh PK, Mukherjee B. Assessment of
nutritional status by mid upper arm
circumference (MUAC) among rural children of
Katihar district in Kosi region of Bihar. Journal
of Evolution of Medical and Dental Sciences.
2015; 4(22):3823-3829.
- Khan I, Parvin N. Nutritional assessment based
on mid upper arm circumference of the hill
Korwas under five year children in Sarguja
district, Chhattisgarh, India. International
Journal of Pharmacy and Biological Sciences.
2018; 8(4):220-226.
- Roy NC. Use of mid-upper arm circumference for
evaluation of nutritional status of children and
for identification of high-risk groups for
malnutrition in rural Bangladesh. Journal
of Health, Population and Nutrition
2000:171-180.
- Barkley J, Newton C, Maitland K. Severe
malnutrition assessment in children in rural
Kenya. JAMA, 2005; 294:2577.
- Chiabi A, Tchokoteu PF, Takou V, et al.
Anthropometric measurements of children
attending a vaccination clinic in Yaounde,
Cameroon. African Health Sciences.
2008; 8(3):174-179.
- Whye Lian Cheah, Wan Muda WAM, Mohd Hussin ZA,
et al. Factors associated with under nutrition
among children in a rural district of Kelantan,
Malaysia. Asia Pacific Journal of Public
Health. 24(2):330-342.
- Sharma KR. Malnutrition in children aged 6-59
months in Mugu district. J Nepal Health Res
Counc, 2012;10:156-159.
- Dairo MD, Fatokun ME, Kuti M. Reliability of
the Mid Upper Arm Circumference for the
Assessment of Wasting among Children Aged 12-59
Months in Urban Ibadan, Nigeria. Int J
Biomed Sci, 2012;8:140-3.
- Asif M, Aslam M, Altaf S. evaluation of
nutritional status of children using mid-upper
arm circumference (MUAC): A study from Pakistan.
Pak Pediatr J. 2017;41(3):163-7.
- Lohman TG. Anthropometric standardization
reference manual. Human kinetics books
1988:55-68.
- Das S, Banik SD, Bose K. Mid-upper arm
circumference for age and under nutrition among
2 to 6 year old Bauri and Santal children of
Purulia, West Bengal, India. Hum Bio Rev,
2013;2(4):359-372.
- Tigga PL, Sen J, Mondal N. Association of some
socio-economic and socio-demographic variables
with wasting among pre-school children of North
Bengal, India. Ethiopian Journal of Health
Sciences, 2015;25(1):63-72.
- Sayed NE, Mohamed AG, Nofal L. Malnutrition
among Pre-school Children in Alexandria, Egypt.
J Health Population Nutr.
2001;19(4):275-280.
- Paul VK, Sachdev HS, Mavalankar D, et al.
Reproductive health, and child health and
nutrition in India: meeting the challenge. Lancet.
2011;377(9762):332-349.
- Naregal PM, Durgawale PM, Kakade SV.
Association of socioeconomic factors with
nutritional status of 3–6-year-old preschool
children in urban slum areas of Karad. J
Datta Meghe Inst Med Sci Univ.
2023;18:1-7.
- Veghari G, Golalipour MJ. The Comparison of
Nutritional Status Between Turkman and
Non-Tutkman Ethnic Groups in North of IRAN. Journal
of Applied Sciences.
2007;7(18):2635-2640.
- Veghari G. The relationship of ethnicity,
socio-economic factors and malnutrition in
primary school children in north of Iran: a
cross-sectional study. Journal of Research
in Health Sciences 2013;13(1):58-62
- Som S, Pal M, Bhattacharya B, et al.
Socio-economic differentials in nutritional
status of children in the states of West Bengal
and Assam India. J Bisoco Sci. 2006;
38: 625-642
- Mondal N, Sen J. Prevalence of under nutrition
among children (5–12 years) belonging to three
communities residing in a similar habitat in
North Bengal, India. Ann Hum Biol.
2010;37:198–216.
- Biswas S, Bose K. Effect of Number of Rooms
and Sibs on Nutritional Status among Rural
Bengalee Preschool Children from Eastern India,
Coll. Anthropol. 2011;35(4): 1017–1022.
- Bisai S, Mahalanabis D, Sen A, et al. Maternal
Education, Reported Morbidity and Number of
Siblings are Associated with Malnutrition among
Lodha Preschool Children of Paschim Medinipur,
West Bengal, India. International Journal
of Pediatrics (Supplement 6),
2014;2(11):13-21.
- Chirande L, Charwe D, Mbwana H, et al.
Determinants of stunting and severe stunting
among under-fives in Tanzania evidence from the
2010 cross-sectional household survey. BMC
Pediatrics. 2015;15:1-13.
doi:10.1186/s12885-015-0482-9.
- Kavosi E, Rostami ZH, Kavosi Z, et al.
Prevalence and determinants of under-nutrition
among children under six: a cross-sectional
survey in Fars province, Iran. Int J Health
Policy Manag. 2014;3(2):71–76.
- Tette EMA, Sifah EK, Nartey ET, et al.
Maternal profiles and social determinants of
malnutrition and the MDGs: What have we learnt?
BMC Public Health 2016;16(214):1-11.
doi: 10.1186/s12889-016-2853-z.
|


