|
Introduction
Nutrition
plays profound role in progress of a nation by
enhancing physical and mental efficiency of its
people and diseases reduction contribute
significantly in this process. These issues have
drawn the attention of policy makers to prioritize
actions for nutritional wellbeing [1]. Besides
health nutrition affects functionality of aged
people [2]. Older people are vulnerable to
under-nutrition as a consequence of biological,
physiological, social and psychological changes
associated with ageing [3]. Decreasing
independence, financial restriction, food
anxieties, multiple morbidities, social isolation
and widowhood and bereavement jeopardize
nutritional status in old age in an interacting
manner [4].
In Indian context
under nutrition has been viewed as state of being
poorly nourished and this has more relevance in
old age. Government of India has given due
priority to raising nutritional status of Indian
population. Considering vulnerability of children
and pregnant women initial focus was directed to
them. However, it was gradually realized that
nutritional status of adolescents and elderly has
been far from satisfactory. Adolescent nutrition
is currently in the agenda of government. It was
assumed that geriatric subjects enjoy prestige in
the society and prevailing socio cultural context
will take care of nutritional requirement of
geriatric subjects. Epidemiological and nutrition
transitions have made geriatric population
vulnerable in achieving optimum nutritional health
because of variety of reasons. Due to emergence of
nuclear families and socio economic vulnerability
they are at higher risk of Chronic Energy
Deficiency [5].
It is difficult to
reverse physiological changes (viz., loss of taste
sensation, reduced stomach compliance etc)
occurring during old age. Therefore, care of
geriatric subjects should focus on
socio-demographic and socioeconomic issues. There
exist direct association between nutritional
status and socioeconomic status of individuals.
Chronic Energy Deficiency (CED) is common among
older persons who live in poverty and this is
applicable in adult population as well [6].
Nutritional status in older persons is influenced
by their gender, religion, marital status, present
employment and family structure[7]. Widowhood
without financial protection and living support
predisposes to CED. Chronic Energy Deficiency is
likely to be more in elderly who are dependent on
others than those who are independent.
Unfortunately, not much attention has been given
to pinpoint factors contributing to CED in urban
geriatric subjects of this region of India.
Understanding of predictors of CED is prerequisite
for planning and execution of initiatives for
tackling problem of CED in geriatric subjects on
principle of prioritization. In the existing
scenario it is worthwhile to pinpoint predictors
of chronic energy deficiency in aged subjects.
Materials and Methods
Study design and setting
A community based
cross sectional study was conducted in census
enumeration wards of a district of eastern Uttar
Pradesh. This study was confined to urban
component and the study area Varanasi having
population of 1597051 which happen to be 43.44% of
the entire population of the district [8]. The
district has 90 census enumeration wards.
Subjects and
sample size
For estimation of
sample size prevalence formula was used. With
understanding that major underline factor of
chronic energy deficiency is socio economic
deprivation (SED). The different values used in
the formula were SED (40%) [9], Z value (1.96),
permissible level of error (5%), design effect
(1.5) and non response rate (10%) of estimated
sample size. The final sample size was fixed at
616. Simple random sampling procedure was adopted
to select 9 out of 90 census enumeration wards of
urban Varanasi. For selection of households and
family as well as individual's probability
proportion to size and lottery methods were
applied, respectively. Those who consented for
this study were included whereas those who stayed
in the area for < 6 months and those with
serious mental abnormality were excluded.
Tools and
techniques
The tool of the
study was proforma. At the outset consent of the
subject was obtained using consent form. Socio
demographic and economic characteristics of the
study subjects were obtained by interview
technique and pertinent information was recorded
in the proforma.
Assessment
of Socio Economic status
For assessment of
socioeconomic status Kuppuswamy’s socio economic
scale was used [10]. The parameters utilized for
this purpose were education and occupation of head
of the family and family income. Characterization
of socio economic status was done based on total
score as upper, upper middle, and lower middle the
other two (upper lower and lower) together were
used as proxy indicator of socio economic
deprivation. Each subject was specifically
interviewed for type of ration card possessed by
them.
Assessment
of Nutritional Status
Anthropometric
measurements (weight and height of the subjects)
were done as per standard guidelines.[11] For
measurement of height anthropometric rod with
accuracy of 0.1 cm was used. Body Mass index (BMI)
of the subjects was determined by dividing their
weight (kg)/ height (m2). A subject
with BMI <18.5 kg/m2 was considered
as victim of CED. BMI range for normal, overweight
and obese were 18.5-22.99 kg/m2,
23-24.99kg/m2 and >25 kg/m2,
respectively. This stratification is based on
World Health Organization criteria (2000) for
Asian population.
Ethical
Clearance
Institutional
Ethical Review Committee, Banaras Hindu
University, Varanasi, India was approached for
ethical clearance. After getting ethical clearance
study was initiated in the urban areas of
Varanasi. Bilingual consent form (Hindi and
English version) was used to obtain consent of the
subjects of the study.
Analysis of
Data
IBM Statistical
Package (SPSS) version 22.0 was used for data
analysis. For statistical association Pearson’s
Chi square test was used and cutoff for
significance was p<0.05. All significant
variables were put in the logistic model. Adjusted
Odds Ratios and 95% Confidence Interval were
computed to find out predictors of chronic energy
deficiency.
Results
General characteristics
Out of 616 geriatric
subjects 63.6% belonged to 60-69 years whereas,
28.1% subjects were 70-79 years and rest (8.3%)
were from > 80 years. Nearly 13 out of 20
(64.6%) subjects were living with their spouse,
whereas 35.4% were without spouse. In case of
82.6% subject’s religion was Hindu; 51.6% belonged
to Other Backward Caste followed by Others (32.5%)
and rest were from Scheduled Caste/Scheduled Tribe
(15.9%) caste categories. Subjects belonging to
joint/three generation families were 70.4%; 29.6%
subjects were from nuclear family. As much as
16.9% subjects were self engaged in income
generation activities, whereas, 17.9% subjects
were unemployed. Nearly four out of ten subjects
were illiterate and 33.4% subjects had educational
status as high school and above. As per Kuppuswamy
classification 41.9% subjects were in
socioeconomically disadvantaged position whereas,
25.3% subjects were from upper middle class.
Subjects belonging to upper lower and lower middle
were 35.2% and 26.0%, respectively. Out of 616
subjects in this study, 598 (97.1%) were provided
card and of these 85 (14.2%) were below poverty
line.
Associates
of Chronic Energy Deficiency
Out of 616 subjects'
anthropometric measurements of 4 subjects were not
recorded because of their bending position hence
nutritional status of 612 subjects was assessed.
As per World Health Organization Asian
classification 44.8% subjects were victim of CED
whereas, 16.2% subjects were either overweight or
obese. Nearly 4 out of 10 (39.1%) subjects
classified as normal. In this study association of
nutritional status of subjects with
socio-demographic variables have been done to find
out the influencing factors of CED in geriatric
subjects. There existed significant (p<0.01)
association of nutritional status with age,
marital status, religion and occupation of the
subjects (Table 1). However, nutritional status of
study subjects was not significantly (p>0.05)
influenced by caste, gender, size and type of
family.
|
Table 1: Association of nutritional
status of subjects with their demographic
variables
|
|
Particulars
|
N (612)
|
CED (N= 274)
|
Normal (N= 239)
|
Overweight/Obese (N= 99)
|
Test of significance
|
|
No.
|
(%)
|
No.
|
(%)
|
No.
|
(%)
|
|
Age (years)
|
|
60-69
|
392
|
142
|
36.2
|
165
|
42.1
|
85
|
21.7
|
χ2: 46.11; df: 4;
p:<0.01
|
|
70-79
|
173
|
97
|
56.1
|
62
|
35.8
|
14
|
8.1
|
|
>80
|
47
|
35
|
74.5
|
12
|
25.5
|
00
|
0.0
|
|
Marital status
|
|
Married
|
396
|
161
|
40.3
|
153
|
38.6
|
82
|
20.7
|
χ2:19.71; df:4; p:<0.01
|
|
Widower
|
90
|
50
|
55.6
|
32
|
35.6
|
8
|
8.9
|
|
Widowed
|
126
|
63
|
50.0
|
54
|
42.9
|
9
|
7.1
|
|
Religion
|
|
Hindu
|
506
|
207
|
40.9
|
210
|
41.5
|
89
|
17.6
|
χ2:17.82; df:2; p:<0.01
|
|
Muslim
|
106
|
67
|
63.2
|
29
|
27.4
|
10
|
9.4
|
|
Occupational status
|
|
Self Employed
|
102
|
48
|
47.1
|
39
|
38.2
|
15
|
14.7
|
χ2:39.48; df:12; p:<0.01
|
|
Service
|
26
|
8
|
30.8
|
13
|
50.0
|
5
|
19.2
|
|
Retired
|
45
|
11
|
24.4
|
19
|
42.2
|
15
|
33.3
|
|
Skilled worker
|
45
|
24
|
53.3
|
19
|
42.2
|
2
|
4.4
|
|
Unskilled worker
|
3
|
2
|
66.7
|
1
|
33.3
|
0
|
.0
|
|
House wife
|
282
|
113
|
40.1
|
114
|
40.4
|
55
|
19.5
|
|
Unemployed
|
111
|
68
|
62.4
|
34
|
31.2
|
7
|
6.4
|
Extent of CED was
36.2% in 60-69, 56.1 %in 70-79 and 74.5% in >
80 years age group. None of the subjects > 80
years were either overweight or obese; whereas
21.7% participants were from 60-69 years and 8.1%
subjects belonging to 70-79 years age group were
either overweight or obese. CED was maximum
(55.6%) in widower, and this was least (40.3%) in
married subjects; half of the widowed subjects had
CED. As much as 20.7% married, 8.9% widower and
7.1% widowed subjects were either overweight or
obese. Extent of CED was 40.9% in Hindu and 63.2%
in Muslim subjects, whereas overweight/obesity was
present in 17.6% Hindu and 9.4% in Muslim
subjects. Extent of Chronic Energy Deficiency was
maximum (66.7%) in unskilled subjects whereas
prevalence of overweight/obesity was maximum
(33.3%) in retired subjects and nil in unskilled
workers. CED was maximum in SC/ST (53.1%),
subjects from joint family (49.2%) and having
family size > 6 (47.6%), whereas
overweight/obesity was maximum in others caste
category (19.7%), subjects from nuclear family
(20.4%) and having family size 3 to 6 (19.7%).
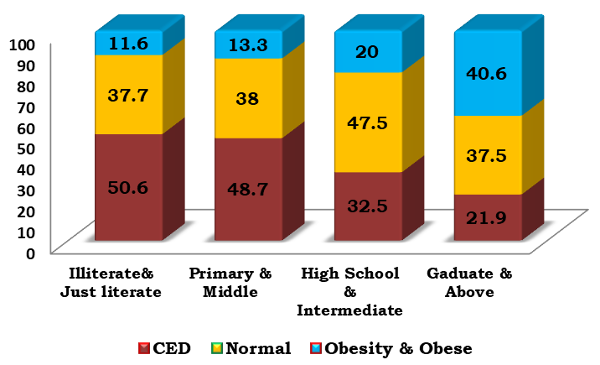
Nutritional status of participants was
significantly influenced (p<0.01) by their
education. Extent of CED in subjects with
educational status just literate and below was
50.6% whereas, this was 53.1%, 41.7%, 33.3%, 31.0%
and 21.9% in participants having educational
status as 5th standard (primary) and 8th
standard (Middle) secondary, senior secondary and
graduate and above, respectively. Prevalence of
overweight/obesity was maximum (40.6%) in subjects
with educational status as graduate and above and
this was least (11.6%) in illlterate and
just literate subjects (Figure 1).
|
| Figure
1: Educational and nutritional status of
study subjects (N=612) |
Nutritional status
of the participants was significantly influenced
by socioeconomic status and type of card (Table
2). Extent of CED was least (26.2%) in upper SES;
whereas 56.4%, upper lower plus lower, 43.0% lower
middle and 32.3% upper middle SES subjects were
victim of CED. Prevalence of overweight and
obesity was maximum (40.5%) in upper SES and this
was least in upper lower plus lower SES (7.8%).
CED was maximum (66.2%) in subjects with white
card and this was least in those without card
(38.9%).
|
Table 2: Association of nutritional
status of subjects with socioeconomic
status
|
|
Particulars
|
N (612)
|
CED (N= 274)
|
Normal (N= 239)
|
Overweight/Obese (N=
99)
|
Test of significance
|
|
No.
|
(%)
|
No.
|
(%)
|
No.
|
(%)
|
|
Socio Economic Status
|
|
Upper
|
42
|
11
|
26.2
|
14
|
33.3
|
17
|
40.5
|
χ2: 53.19;
df: 8; p:<0.01
|
|
Upper middle
|
155
|
50
|
32.3
|
68
|
43.9
|
37
|
23.9
|
|
Lower middle
|
158
|
68
|
43.0
|
65
|
41.1
|
25
|
15.8
|
|
Upper lower
|
216
|
125
|
57.9
|
73
|
33.8
|
18
|
8.3
|
|
Lower
|
41
|
20
|
48.8
|
19
|
46.3
|
2
|
4.9
|
|
Type of Card
|
|
Yellow
|
509
|
211
|
41.5
|
209
|
41.1
|
89
|
17.5
|
χ2: 18.94; df: 6; p:<0.01
|
|
White
|
71
|
47
|
66.2
|
18
|
25.4
|
6
|
8.5
|
|
Red/pink
|
14
|
9
|
64.3
|
3
|
21.4
|
2
|
14.3
|
|
No card
|
18
|
7
|
38.9
|
9
|
50.0
|
2
|
11.1
|
Predictors of Chronic Energy Deficiency
The logistic
regression analysis was done to pinpoint
predictors of Chronic Energy Deficiency in
geriatric subjects (Table 3). This analysis
eliminated the influence of marital and
occupational status obtained in bivariate
analysis. However, Adjusted Odds Ratio was 1.39
(95% CI: 0.78-2.46) for widower and 1.02 (95% CI:
0.60-1.73) for widowed subjects. In comparison to
service plus retired plus self employed subjects
AOR for CED was 1.69 (0.77-3.72) for
skilled/unskilled workers and 1.47 (0.83-2.61) for
unemployed subjects though it is not significant
at 5% level. On the basis of logistic regression
analysis significant AOR was obtained for age,
religion, literacy status, socio economic status
and type of card. AOR for under nutrition was 4.05
(95% CI: 1.52- 10.77) in > 80 years and 2.20
(95%CI: 1.4-3.43) in 70-79 years age group. In
comparison to Hindu, Muslim subjects had
significantly higher AOR (2.16; 95%CI: 1.31-3.56)
for CED. Logistic analysis revealed that when
subjects having educational status intermediate
and above were considered as reference
significantly (p<0.05) higher AOR for CED
prevailed for illiterate and just literate (AOR
2.53; 95% CI: 1.10-5.81) and primary plus middle
(AOR 2.42; 95%CI 1.08-5.44). Subjects belonging to
upper plus upper middle and lower middle
categories had significantly (p <0.05) less AOR
for CED than subjects from lower socio economic
status (AOR 1.74; 95%CI: 1.02-2.96). AOR for CED
in subjects with white and Red/Pink ration card
was 1.79 (95%CI: 1.03-3.11).
|
Table 3: Predictors of Chronic Energy
Deficiency
|
|
Socio demographic and economic
characteristics
|
Estimate of b
|
SE of b
|
P value
|
AOR
|
95% CI
|
|
Lower
|
Upper
|
|
Age (years)
|
≥ 80
|
1.39
|
0.49
|
0.005
|
4.05
|
1.52
|
10.77
|
|
70-79
|
0.79
|
0.23
|
0.000
|
2.20
|
1.43
|
3.43
|
|
60-69 (Reference)
|
---
|
---
|
---
|
---
|
---
|
---
|
|
Marital status
|
Widower
|
0.33
|
0.29
|
0.267
|
1.39
|
0.78
|
2.46
|
|
Widowed
|
0.02
|
0.27
|
0.943
|
1.02
|
0.60
|
1.73
|
|
Married (Reference)
|
---
|
---
|
---
|
---
|
---
|
---
|
|
Religion
|
Muslim
|
0.77
|
0.25
|
0.002
|
2.16
|
1.31
|
3.56
|
|
Hindu (Reference)
|
---
|
---
|
---
|
---
|
---
|
---
|
|
Educational status
|
Illiterate + Just literate
|
0.93
|
0.42
|
0.028
|
2.53
|
1.10
|
5.81
|
|
Primary+ Middle
|
0.88
|
0.41
|
0.033
|
2.42
|
1.08
|
5.44
|
|
10th standard and above
|
0.58
|
0.44
|
0.187
|
1.78
|
0.76
|
4.17
|
|
12th standard + Graduate and
above (Reference)
|
---
|
---
|
---
|
---
|
---
|
---
|
|
Occupation
|
Skilled Unskilled worker
|
0.53
|
0.40
|
0.187
|
1.69
|
0.77
|
3.72
|
|
Housewife
|
0.33
|
0.26
|
0.207
|
0.72
|
0.43
|
1.20
|
|
Unemployed
|
0.38
|
0.29
|
0.192
|
1.47
|
0.83
|
2.61
|
|
Service + Retired +Self Employed
(Reference)
|
---
|
---
|
---
|
---
|
---
|
---
|
|
Kuppuswamy SES
|
Lower
|
0.55
|
0.27
|
0.042
|
1.74
|
1.02
|
2.96
|
|
Upper lower
|
0.28
|
0.27
|
0.308
|
1.32
|
0.78
|
2.25
|
|
Upper+ Upper middle+ lower middle
(Reference)
|
---
|
---
|
---
|
---
|
---
|
---
|
|
Ration Card
|
White+ Red/ Pink
|
0.58
|
0.28
|
0.038
|
1.79
|
1.03
|
3.11
|
|
Yellow (Reference)
|
---
|
---
|
---
|
---
|
---
|
---
|
Discussion
Several
physiological functions can alter nutritional
wellbeing of aged persons resulting in reduced
Body Mass Index. It was observed in this study
that with progressing age there was decline in
subjects with normal Body Mass Index and
increasing trend of CED; seven out of twenty from
the age group 60-69 years have been victim of CED;
in contrast to this, three out of four subjects
> 80 years had CED. In conformity of the
present study several workers also observed higher
prevalence of under nutrition with advancing age
[7,13,14]. Half of widowed, 11 out of 20 widower,
and 4 out of 10 married subjects of this study had
CED, these findings are consistent with the
scenario presented in studies conducted in South
India [7,15]. Adversities of nutritional status in
single, widowed and divorced subjects may be due
to lower economic and social support. In
consonance with finding of present study
religion-wise difference in nutritional status has
been also observed in a study conducted on urban
and rural geriatric subjects [7]. In contrast to
findings regarding similar nutritional status of
male and female subjects of present study there
are several evidences substantiated gender as a
predictor of nutritional status [14,16,17]. Though
in the present study gender was not found
significantly associated with nutritional status
however, higher percentage of geriatric female is
in category of obesity/obese than male was
observed. It could be attributed to the fact that
females particularly after middle age tend to live
sedentary life style while male subjects have to
continue working because of economic constraints
which make them active to lead a normal health
status. In female the low levels of estrogens and
progesterone after menopause result into
overweight/obesity and their risk factors [16].
Variations in nutritional status of geriatric
subjects observed in different studies may be due
to difference in tools and criteria, geographical
context and their demographics. Contrary to
present observation significant association
between nutritional status and type of family has
been reported from a study conducted in South
India [7]. Although CED was more in subjects form
large family size (>6) the association between
nutritional status and family size have not been
significant at 95% level. In the present study
extent of CED was highest in SC/ST caste. However,
nutritional status of subjects was not
significantly different in different caste
categories. Living alone was not considered for
bivariate analysis in this study. However, finding
of a study from Iran revealed that under nutrition
has been significantly more frequent in the older
people living alone before nursing home placement
[18].
In conformity with
the finding of present study significant linkage
between literacy and nutritional status, has been
observed in Indian studies conducted in
Karnataka[7]; Rajasthan[19] and Eastern Uttar
Pradesh [13]. Finding of significant association
of occupation with nutritional status is
consistent with the observations made by other
workers as well[7,19].
Socio Economic
Status (SES) has been considered as an important
predictor of nutritional status. Irrespective of
parameter adopted for SES it has been observed
that if a subject was at lower level of SES there
was more prevalence of CED whereas reverse trend
was observed for obesity/overweight; with
increasing socio economic status lower prevalence
of CED has been reported by several workers [7,15,19,20].
Subjects having lower per capita income have more
adversities for nutritional status [13].
If geriatric subjects are dependent on others,
chances of nutritional adversities are more
[7,20]. A study conducted in Coimbatore observed
that geriatric subjects without access to pension
had more under-nutrition than those having
pension. It has been observed that with increasing
number of lifestyle, somatic, functional and
social factors there had been lower Mini
Nutritional Assessment (MNA) Scores of subjects
[15].
In consonance with
the findings of the present study in logistic
model, increasing age has been identified as risk
for under nutrition by other workers [4,21,22].
Marital status as single/widowed/divorced than
married has higher odds of under nutrition
[4,15,22,23]. However, significant association
between marital status and nutritional status
observed in the present study in bivariate
analysis was not substantiated by the logistic
model. Besides the present study lower income or
socio economic status in reality or in perceived
form have been identified as predictor of under
nutrition by several workers [15,22,23,24]. No
pension to those having pension has been
identified as predictor of malnutrition [15].
Higher Adjusted Odd Ratios in older geriatrics
belonging to Muslim religion, having educational
status as illiterate, just literate, primary plus
middle and subjects from lower socio economic
status call for focused and targeted interventions
for improving nutritional status of geriatric
population.
Conclusion
Subjects in higher
age, from Muslim religion, having educational
status less than intermediate, lower and lower
upper socio economic status and with white/pink
ration card had higher risk for CED. It is
imperative that targeted and focused strategies
giving considerations to these risk factors can
give optimum dividend in terms of improvement of
nutritional status of geriatric population.
Acknowledgement
Authors would like
to acknowledge all subjects for their
participation and corporation for this study.
References
- Mishra CP, Khanam Z. Food Security: Challenges
and Options. Indian J Prev. Soc. Med.
2010; 41:1-10
- Rathnayake KM, Wimalathunga MPPM, Weech Metal.
Higher Prevalence of under nutrition and low
dietary diversity in institutional elderly
living in Sri Lanka. Public Health
Nutrition 2015; 18 (15): 2874-2880
- Ahmed T, Haboubi N. Assessment and management
of nutrition in older people and its importance
to health. Clin Interv Aging. 2010; 5:
207-2016.
- Brownie S. Why are elderly individuals at risk
of nutritional deficiency? Inc J NursPract.
2006; 12:110-8.
- Mishra CP, Gupta PK. Correlates of nutritional
status in geriatric population of a rural area
of Varanasi. Indian J Prev. Soc. Med.
2012; 43 (1): 6-10
- Pryer J, Rogers S. Epidemiology of
Under-nutrition in Adults in Dhaka Slum
households, Bangladesh. Eur J Clin Nutr,
2006; 60: 815- 822.
- Ananthesh BG, Bthija GV, Bant DD. A community
based cross sectional study to assess
malnutrition among elderly population residing
in urban and rural areas of district in
Karnataka. India. Int J community Med Public
Health. 2017; 4 (1): 51-58.
- Registrar General and Census Commission of
India. Census of India, Ministry of Home Affair,
Government of India. 2011. Available at http://censuaindia.gov.in
- Pandey MK. Poverty and disability among Indian
Elderly: Evidence from Household Survey. ASARC
Working Paper 2009/09; 1-19.
- Kohli C, Kishore J, Kumar N. Kuppuswamy’s
Socioeconomic Scale-Update for July. Int J
Preven Curat Comm Med. 2015; 1(2):26-28.
- Jelliffe DB. The assessment of the nutritional
status of the community. WHO, Geneva. 1966;
7-233.
- World Health Organization (WHO). International
Association for the Study of Obesity (IASO) and
International Obesity Task Force (IOTF). The
Asia Pacific Perspective: Refining Obesity and
its treatment, Geneva: World Health
Organization: 2000; 378-420.
- Yadav N, Ravindra R, Sharma S, Singh A, Mishra
M, Dubey J. Dietary habits and nutritional
status of elderly living in urban areas of
Allahabad district. Indian J Prev. Soc.
Med. 2012; 43 (1): 81-86.
- Swami HM, Bhatia V, Gupta AK, Bhatia SPS. An
epidemiological study of obesity among elderly
in Chandigarh. Indian Journal of Community
Medicine. 2005; 30 (1):11-13.
- Mathew AC, Das D, Sampath S, Vijayakumar M,
Ram Krishnan N, Ravishankar SL Prevalence and
correlates of malnutrition among elderly in an
urban area in Coimbatore. Indian Journal of
Public Health, 2016; 6 (2): 112-117.
- Saxena V, Kandpal SD, Goel D, Bansal S. Health
status of elderly- A community based study. Indian
Journal of Community Health. 2012; 24
(4): 269-270.
- Singh A, Sahai D, Mathur N. A study on
Prevailing Malnourishment among elderly
population of Lucknow city. International
Journal of Agriculture and Food Science
Technology, 2014; (5): 35-40
- Sakineh NS, Turkan KM, Peyman M, Yenar B.
Assessment of the nutritional status and
affecting factors of elderly people living at
six nursing home in Urmia, Iran. Int J Acad
Res. 2011; 3:173-181.
- Shivraj M, Singh V, Meera B, Singh K. Study of
nutritional status in elderly in Indian
population. Int J Current Res, 2014; 6
(11):10253-7.
- Saikia AM, Mahanta N, Saikia AM, Deka H,
Boruah B, Mahanta R. Depression in elderly: a
community based study from Assam. Indian
Journal of Basic and Applied Medical Research.
2016; 5 (4): 42-48.
- Johansson Y, Bachrach –Lindstrom M, Carstensen
J, Ek AC. Malnutrition in a home living older
population: prevalence, incidence and risk
factors. A prospective study. J Clin Nurs.
2009; 18 (9): 1354-64.
- Simsek H, Maseri R, Sahin S, Ucku R.
Prevalence of malnutrition, factors related to
malnutrition in the elderly: A community-based,
cross-sectional study from Turkey. European
Geriatric Medicine. 2013; 4: 226-230.
- Drewnowski A, Shultz JM. Impact of ageing on
eating behaviours, food choices, nutrition and
health status. J Nutr Health Aging,
2001; 5:75-9.
- Suzana S, Earland J, Suriah AR, Warnes AM.
Social and health factors influencing poor
nutritional status among rural elderly Malays. The
Journal of Nutrition Health and Ageing.
2002; (6):363-369.
|


